Find your way around Astrolize
Find the sidebar, analysis navigator, toolbar and result pane while exploring a saved chart.
On this page (6 sections)
Astrolize for macOS keeps chart selection, analysis selection and the result in separate parts of the main window. This tour uses the invented Iris Vale, born 17 April 1991 at 06:42 in London. Her saved chart lets you compare the same data in a wheel and three tables without entering another birth record.
Find the three main areas
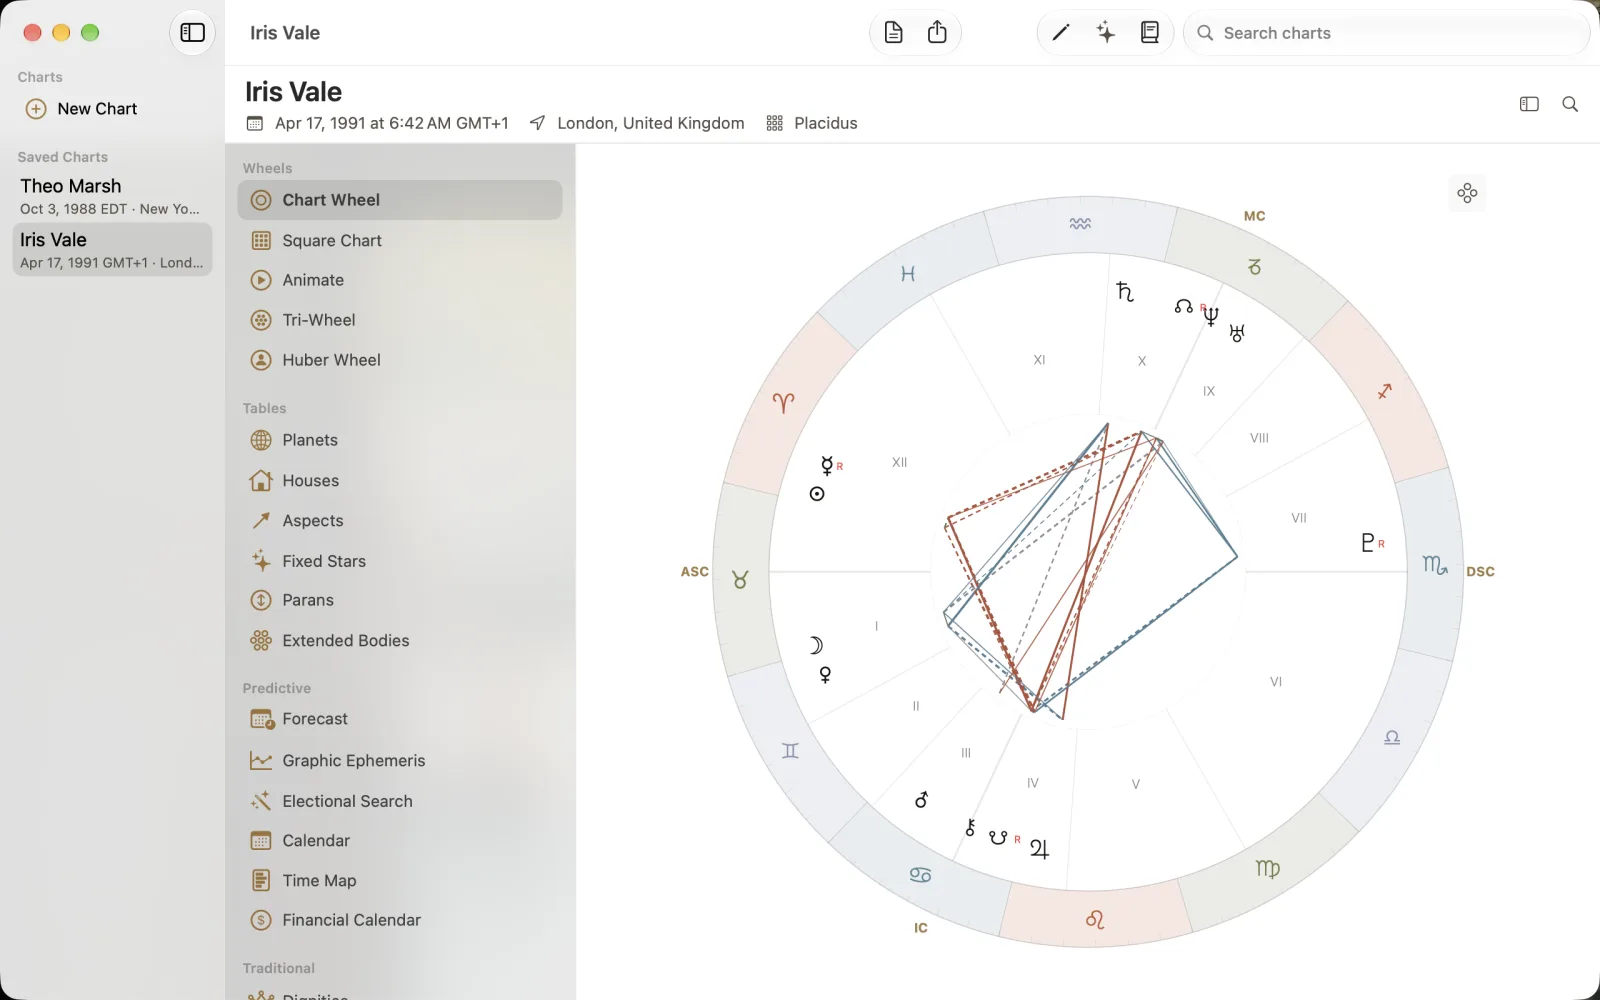
At left, Charts contains New Chart and Saved Charts. The middle column is the analysis navigator; the large result pane shows the selected view. The header identifies Iris, her date and London location, with Placidus houses. The sidebar toggle hides or shows the Charts column. For a saved chart, the toolbar offers Export Text, Export Chart and Edit. Only Chart Wheel adds Extended Bodies and Interpret.
Select Iris Vale in Saved Charts.
Choose Chart Wheel under Wheels and check the result header.
Choose another analysis view in the middle column while keeping Iris selected.
Read positions as a table
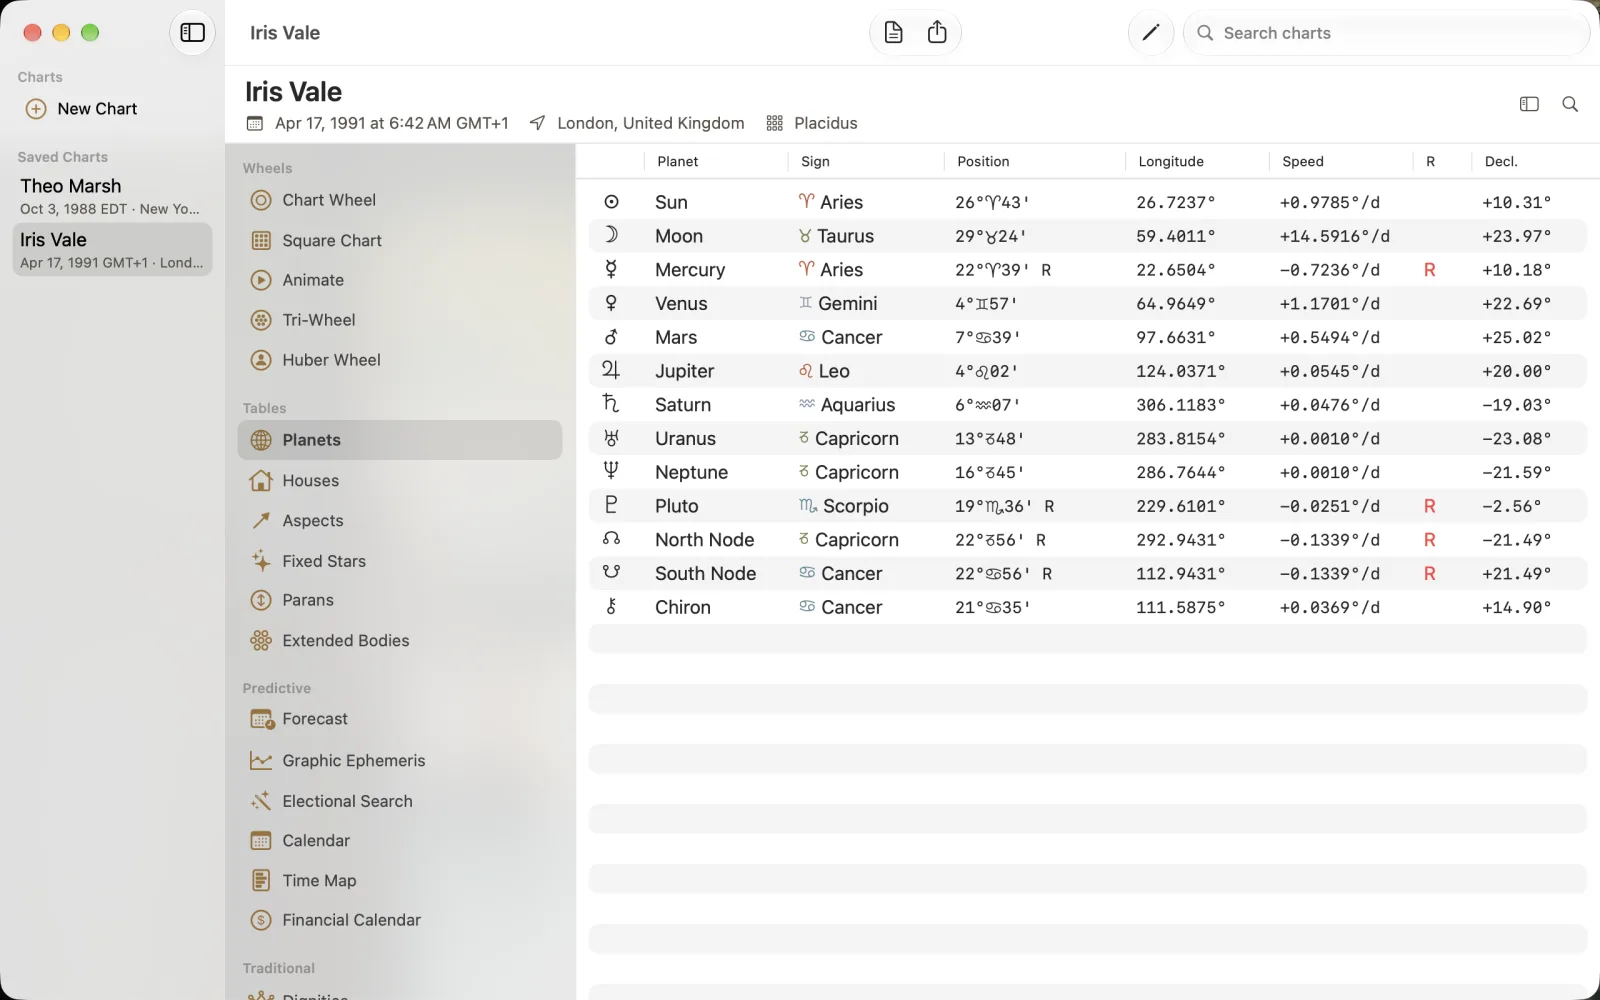
Choose Planets in Tables. Columns include Planet, Sign, Position, Longitude, Speed, R and Decl. Iris's Sun is 26 Aries 43, Moon 29 Taurus 24 and Mercury 22 Aries 39 R. R marks retrograde motion; it is not a different sign or a missing position. Use the column labels to distinguish zodiacal position from speed and declination.
Separate house cusps from angles
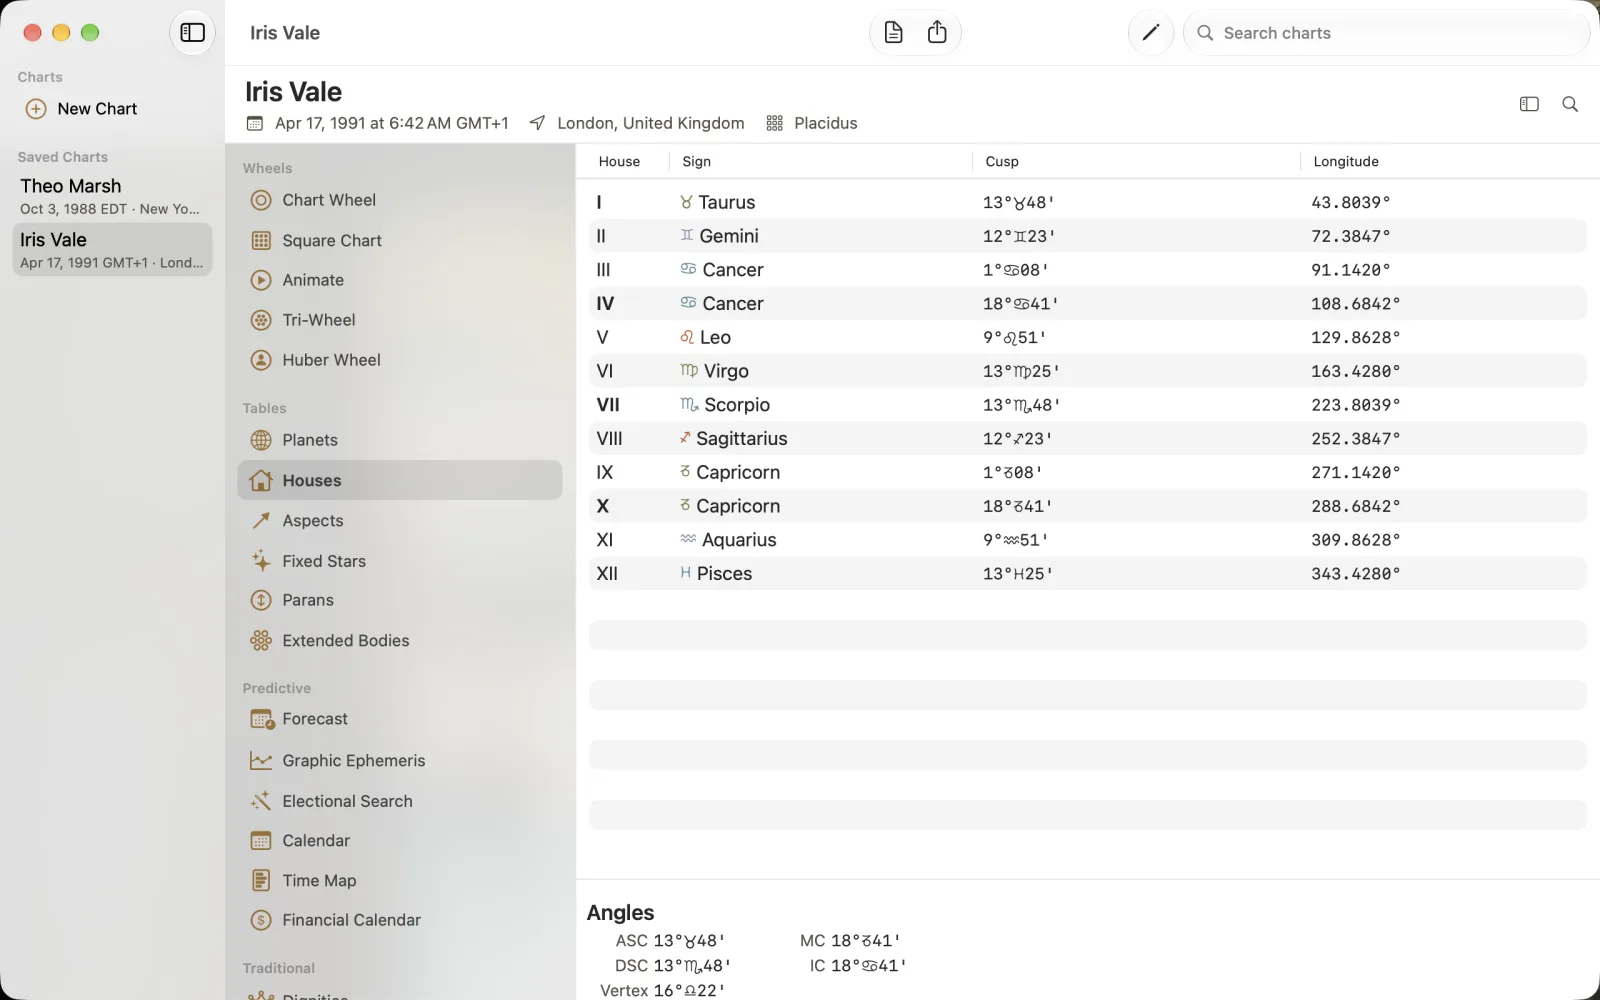
Houses lists House, Sign, Cusp and Longitude. House I is Taurus 13 48. The Angles block below lists ASC 13 Taurus 48, MC 18 Capricorn 41, DSC 13 Scorpio 48, IC 18 Cancer 41 and Vertex 16 Libra 22. Read the named angle instead of assuming every number in the view is a house cusp.
Read an aspect row
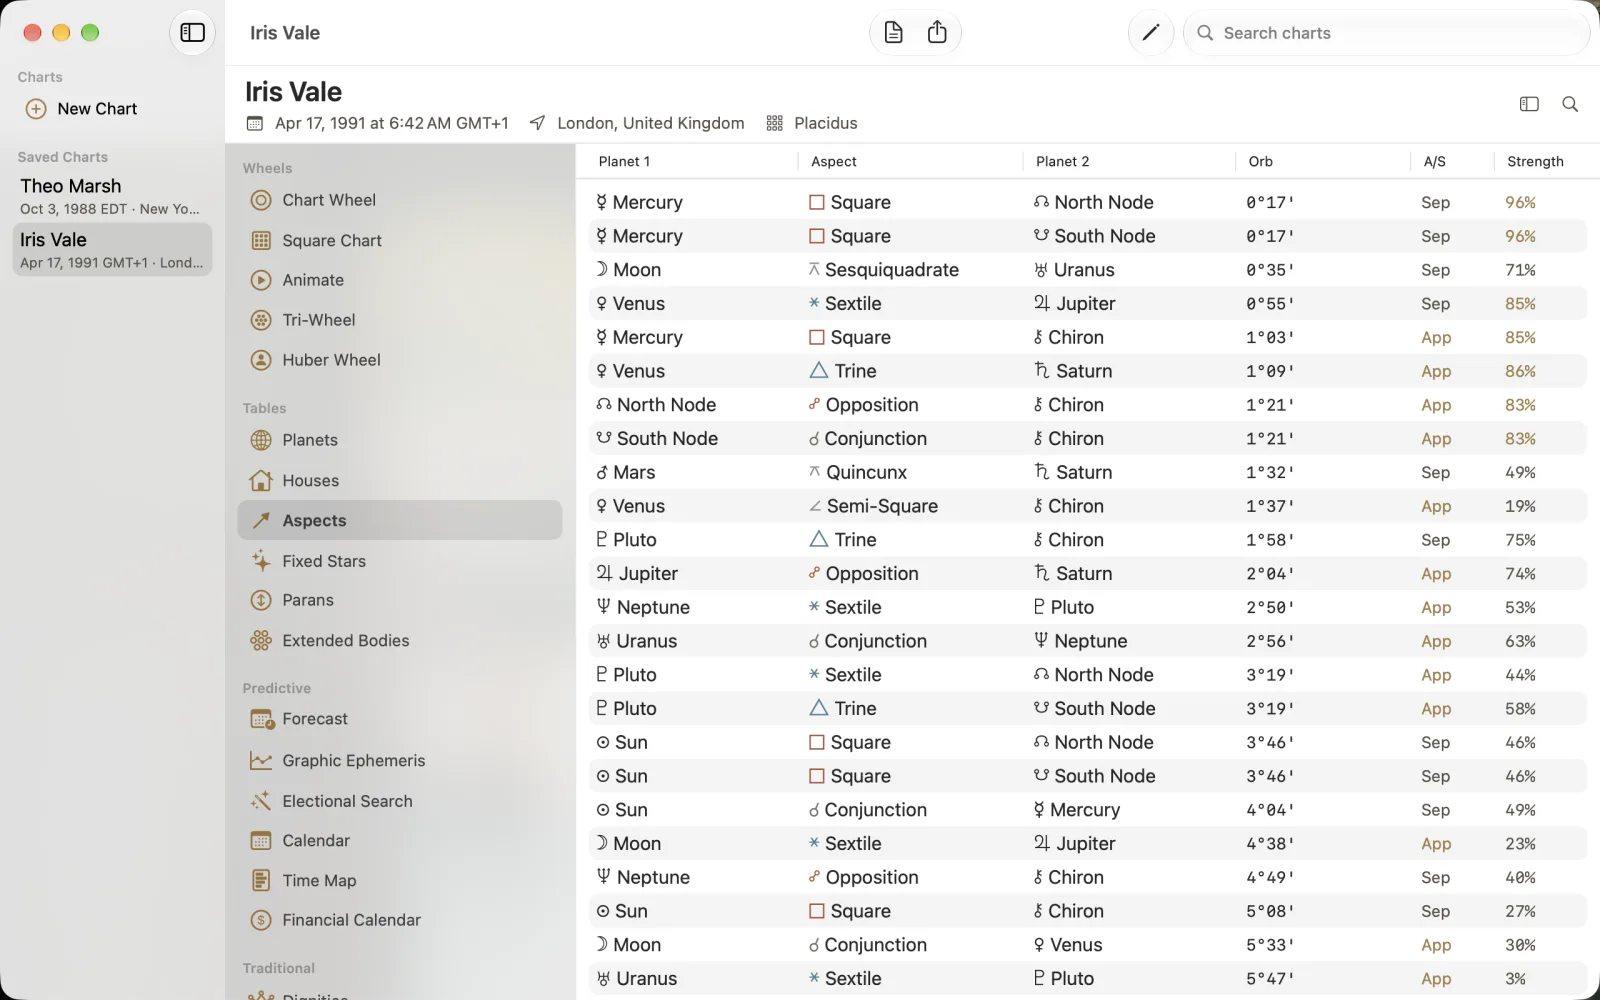
Aspects is a sorted list. It shows Planet 1, Aspect, Planet 2, Orb, A/S and Strength. The tightest row in this example is Mercury square North Node at 0 17. App and Sep distinguish applying and separating; Strength is shown as a percentage. Keep the planet pair, aspect and orb together.
Jump to a named analysis
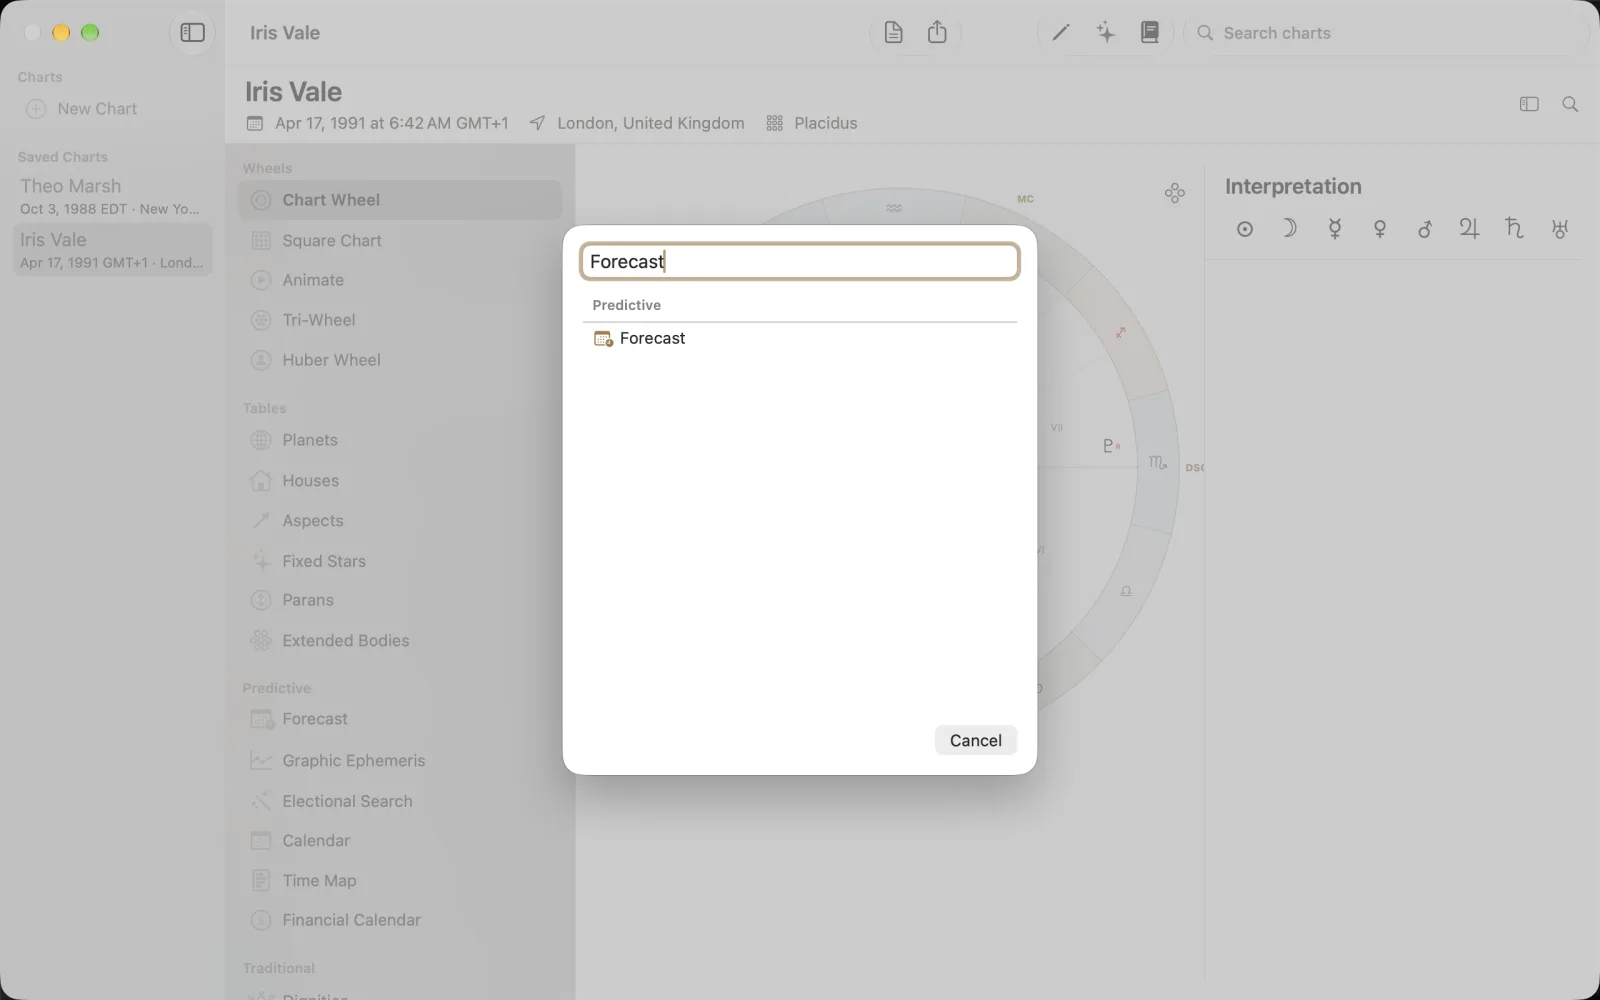
Press Command-K for Jump to analysis view..., type Forecast and press Return to open the highlighted result. Cancel or Escape closes the picker. The navigator groups run in order: Wheels, Tables, Predictive, Traditional, Vedic, Midpoints & Harmonics, Specialized and Tools. The picker filters these analysis destinations by name; Search charts in the toolbar instead filters saved chart records.