Graphic ephemeris
Explore planetary motion over a selected period using the graphic ephemeris.
On this page (3 sections)
Graphic Ephemeris shows planetary motion as lines across time. Open Iris Vale's chart, then choose Graphic Ephemeris in Predictive or through Command-K. Unlike Forecast, this is a graph to inspect, not a dated event list. The pictured range spans 29 June to 29 December 2026 so that October can be read in a wider context.
Orient the full-circle graph
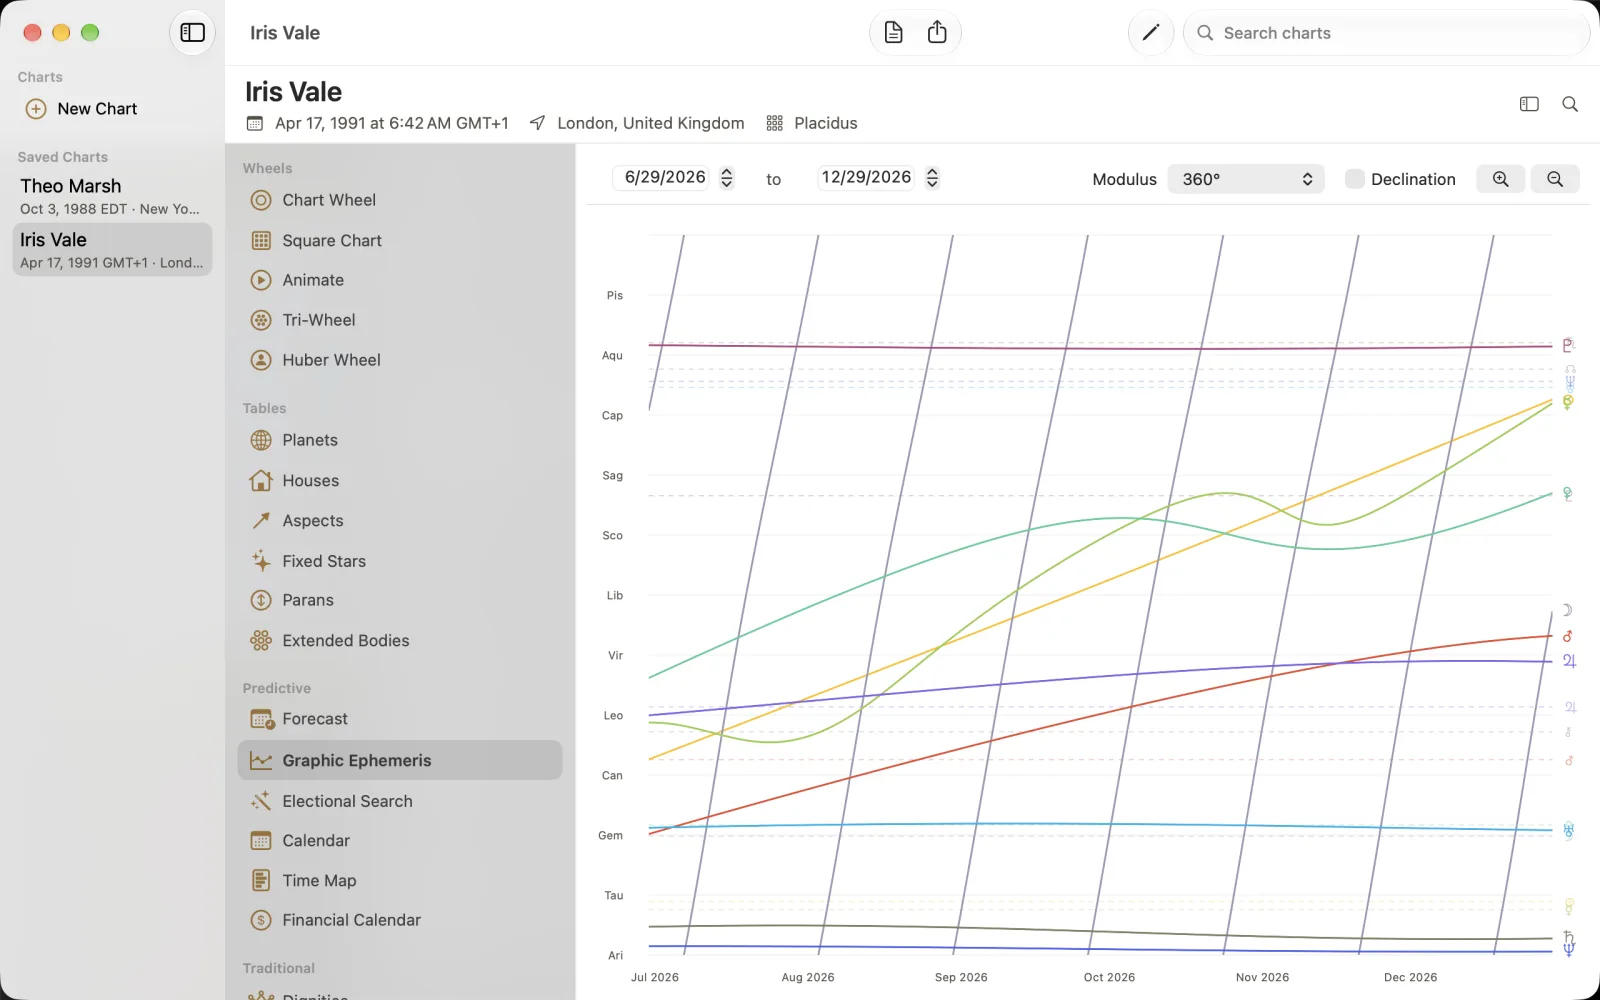
At Modulus 360 degrees, the vertical axis runs through the zodiac signs and the horizontal axis through the months. Each colored planetary line has a glyph at its right end. Dashed horizontal lines mark natal positions. Read a moving curve against its own glyph and the natal reference rather than assuming all horizontal marks are transits.
Select Iris Vale and open Graphic Ephemeris.
Check From and the ending date; the capture uses 29 June through 29 December 2026.
Set Modulus to 360 degrees and use the zoom buttons to inspect a less crowded portion.
Compare the folded 45-degree view
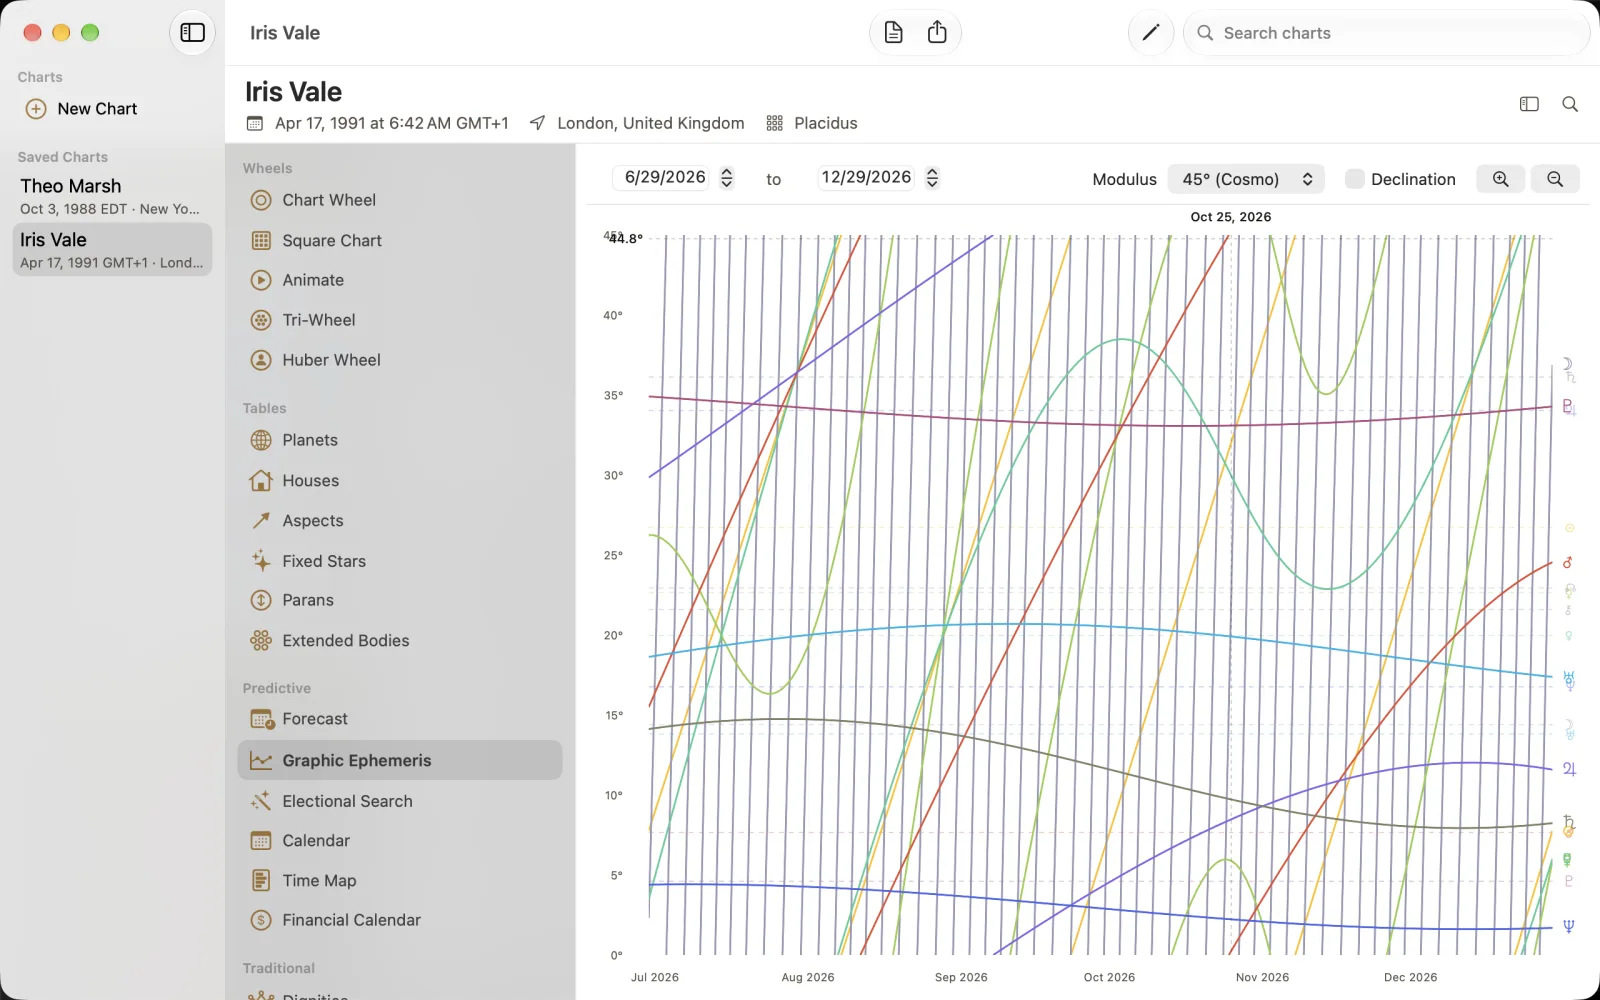
Choose 45 (Cosmo) in Modulus. The vertical axis now spans 0 to 45 degrees and the curves wrap at that boundary. Conjunctions, semi-squares, squares, sesquiquadrates and oppositions can therefore appear as crossings. A crossing does not identify which of those relationships applies without further checking. The pictured hover marker reads Oct 25, 2026; use that date context rather than estimating solely from the spacing of month labels. The same motion has been folded onto another scale, not recalculated as a different birth record.